Interactive reporting with Excel
10/10/2017//
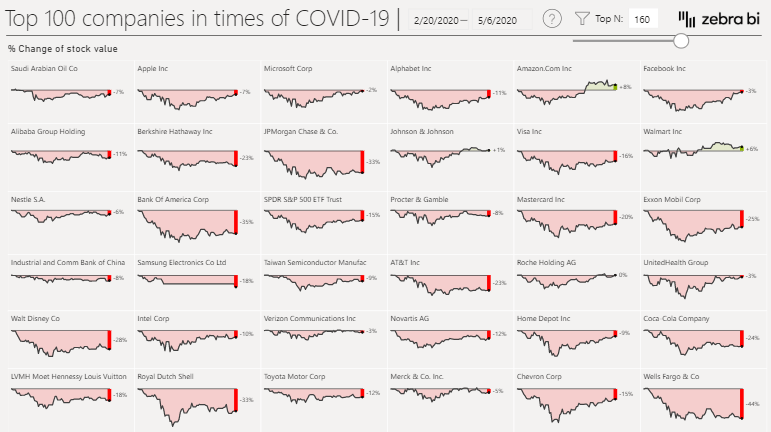
Excel is the software with which every employee in finance department has experience. So why not build reporting with Excel? With the help of a direct database connection and modern tools for visualization, interactive reports can be created easily.
We would like to add more samples to this page. So if you have a report that we should take a close look at, send it to reports@kteam.ch and we will create a prototype for you free of charge and without obligation!
our previous posts
BI Samurai
K Team Solutions has been up and running for over 5 years now and we completed many interesting projects for...
Benefits of having Stripe data in Power BI
It is not easy to manage a company and keep up with the numbers, reports, and analytics. We have a...
The stock market in times of Covid 19
A few days ago, Zebra BI asked if we could help build a Power BI report showing the impact of...
Why (almost) every Power BI report needs a date table?
It happens too often that Power BI reports show incorrect values or don't work at all due to a missing...
HR Reporting with Power BI
When you talk about the HR department, everyone has the feeling of knowing which tasks are being performed every day....
Why not let a robot do the work?
These days we hear a lot about RPA or Robotic Process Automation. The basic principle is that a computer program...
Meaningful Excel charts
Inserting a simple chart into an Excel file is not a problem. Unfortunately, charts are mostly left in the standard...
Adapt SAP reports to the needs of the customer
SAP comes with a few predefined reports. However, these reports only rarely meet the requirements of the business. It is...
K Team Solutions is an official partner of Zebra BI
We are now an official partner of Zebra BI! The Excel add-in from Zebra BI is a very flexible and...
Bring Excel into the desired structure
Many people know the problem of manually changing Excel sheets every month in order for the input or upload to...