Posts by Pascal Kiefer
Dynamic Smiley Face Emojis in Power BI
Recently, I came across a LinkedIn post about an “Emoji Progress Chart” made with Qlik. Many people had already added comments to the post so it looked like adding smiley faces to a business report was considered a good idea (or just plain fun). I simply couldn’t resist recreating this on PowerBI using our HTML…
Read MoreMicrosoft Certificate for the HTML Text Styler

The HTML Text Styler Visual is now certified by Microsoft. This is one of the most important milestones for any Power BI Visual. The Microsoft certification allows the visual to be exported to PDF and PowerPoint directly from the Power BI Service. This is possible because the Microsoft Power BI team has reviewed the source…
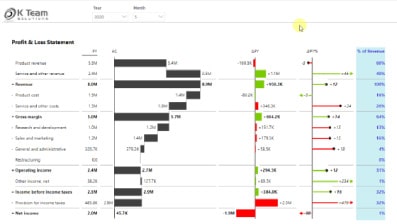
Read MoreBI Samurai

K Team Solutions has been up and running for over 5 years now and we completed many interesting projects for clients from different industries. With the outbreak of Covid 19, we saw that many companies wanted (or needed) to invest in digitalization and that led to quite a lot of new projects for us. New…
Read MoreAccessibility – Dynamic Font Size in Power BI
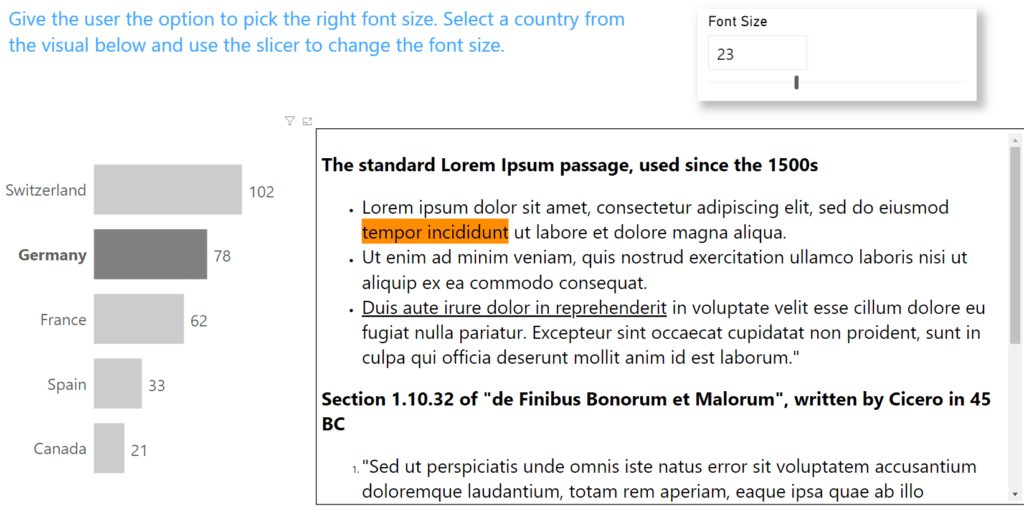
We have all heard the notion “One size fits all” and might have probably wondered what its implications might be in our lives. At first glance, it seems only natural and perfect to have the same thing work out for everybody. There would be fewer troubles regarding compatibilities, and life would be easier. The thing…
Read MoreBenefits of having Stripe data in Power BI
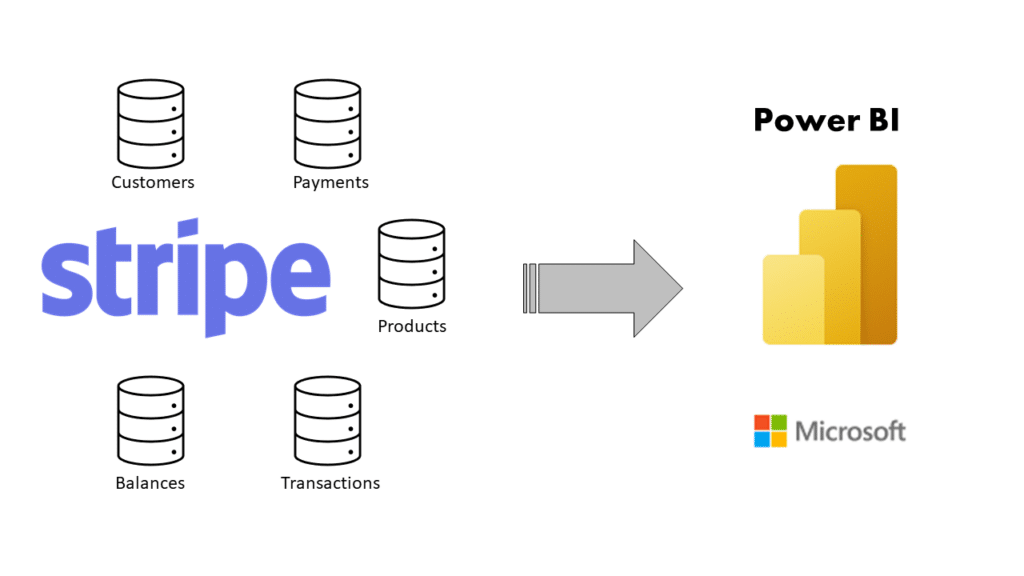
It is not easy to manage a company and keep up with the numbers, reports, and analytics. We have a lot of accurate data, but it is hard to bring it all together. Now imagine all your data in one place where the information can be accessed in seconds. This will improve efficiency and the…
Read MoreHTML Text Styler visual for Microsoft Power BI and why we developed it
Yes that’s right, K Team Solutions has started to develop custom visuals for Microsoft Power BI. And the reason why we did this is quite simple. We are involved in many Power BI projects so we see a lot of different reports from different people and they all miss the same thing… The goal…
Read MorePower BI Help!
Power BI is a self-service business intelligence (BI) tool. This means that the recipient of a report can navigate, filter and analyze it himself. Of course this is a great thing, but only if the user knows what functionality a report contains. The main problem with instructions is that they are never where you are…
Read MoreThe stock market in times of Covid 19
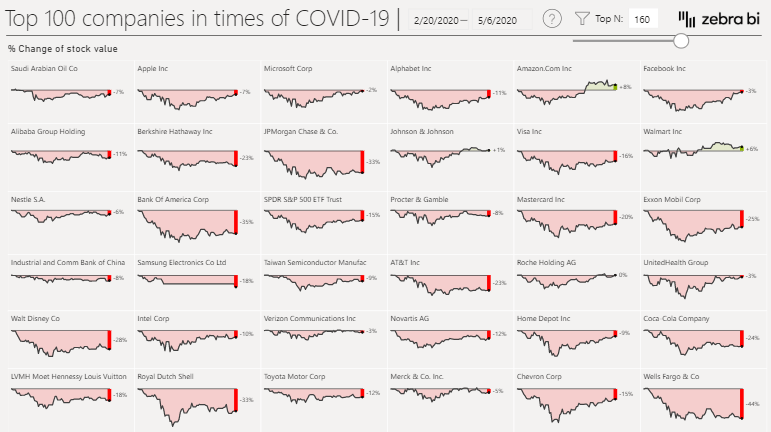
A few days ago, Zebra BI asked if we could help build a Power BI report showing the impact of Covid 19 on the stock market. Of course we got to work immediately and were able to develop a great report in cooperation with the Zebra BI team, which has now been published. We mainly…
Read MoreWhy (almost) every Power BI report needs a date table?
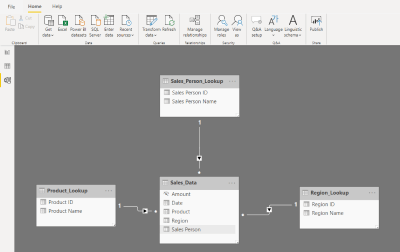
It happens too often that Power BI reports show incorrect values or don’t work at all due to a missing date table. This article is intended to remedy this situation. Since the dimension “time” almost always plays a role in data analysis, the following can be used for practically every Power BI report. One of the…
Read MoreHR Reporting with Power BI

When you talk about the HR department, everyone has the feeling of knowing which tasks are being performed every day. HR employees mostly only deal with writing advertisements, conducting interviews, handing out rejection letters, hiring someone from time to time and paying the wages once a month. However, the reality is very different. In the…
Read More