Power BI is a self-service business intelligence (BI) tool. This means that the recipients of a report can navigate, filter, and analyze it themself. Of course, this is a great thing, but only if the user knows what functionality a report contains.
The main problem with instructions is that they are never where you are looking for them. Accordingly, we have to try to save instructions where the user is looking for them. If someone has a question about a report, chances are that this question came up while looking at the report. So why not integrate the instructions directly into the report?
This is exactly how we do it.
Of course, you could simply integrate an additional page with instructions in text form in the report. But you don’t need a blog post for this. What I want to show you is much more intuitive than just text.
1. Visual header tooltip
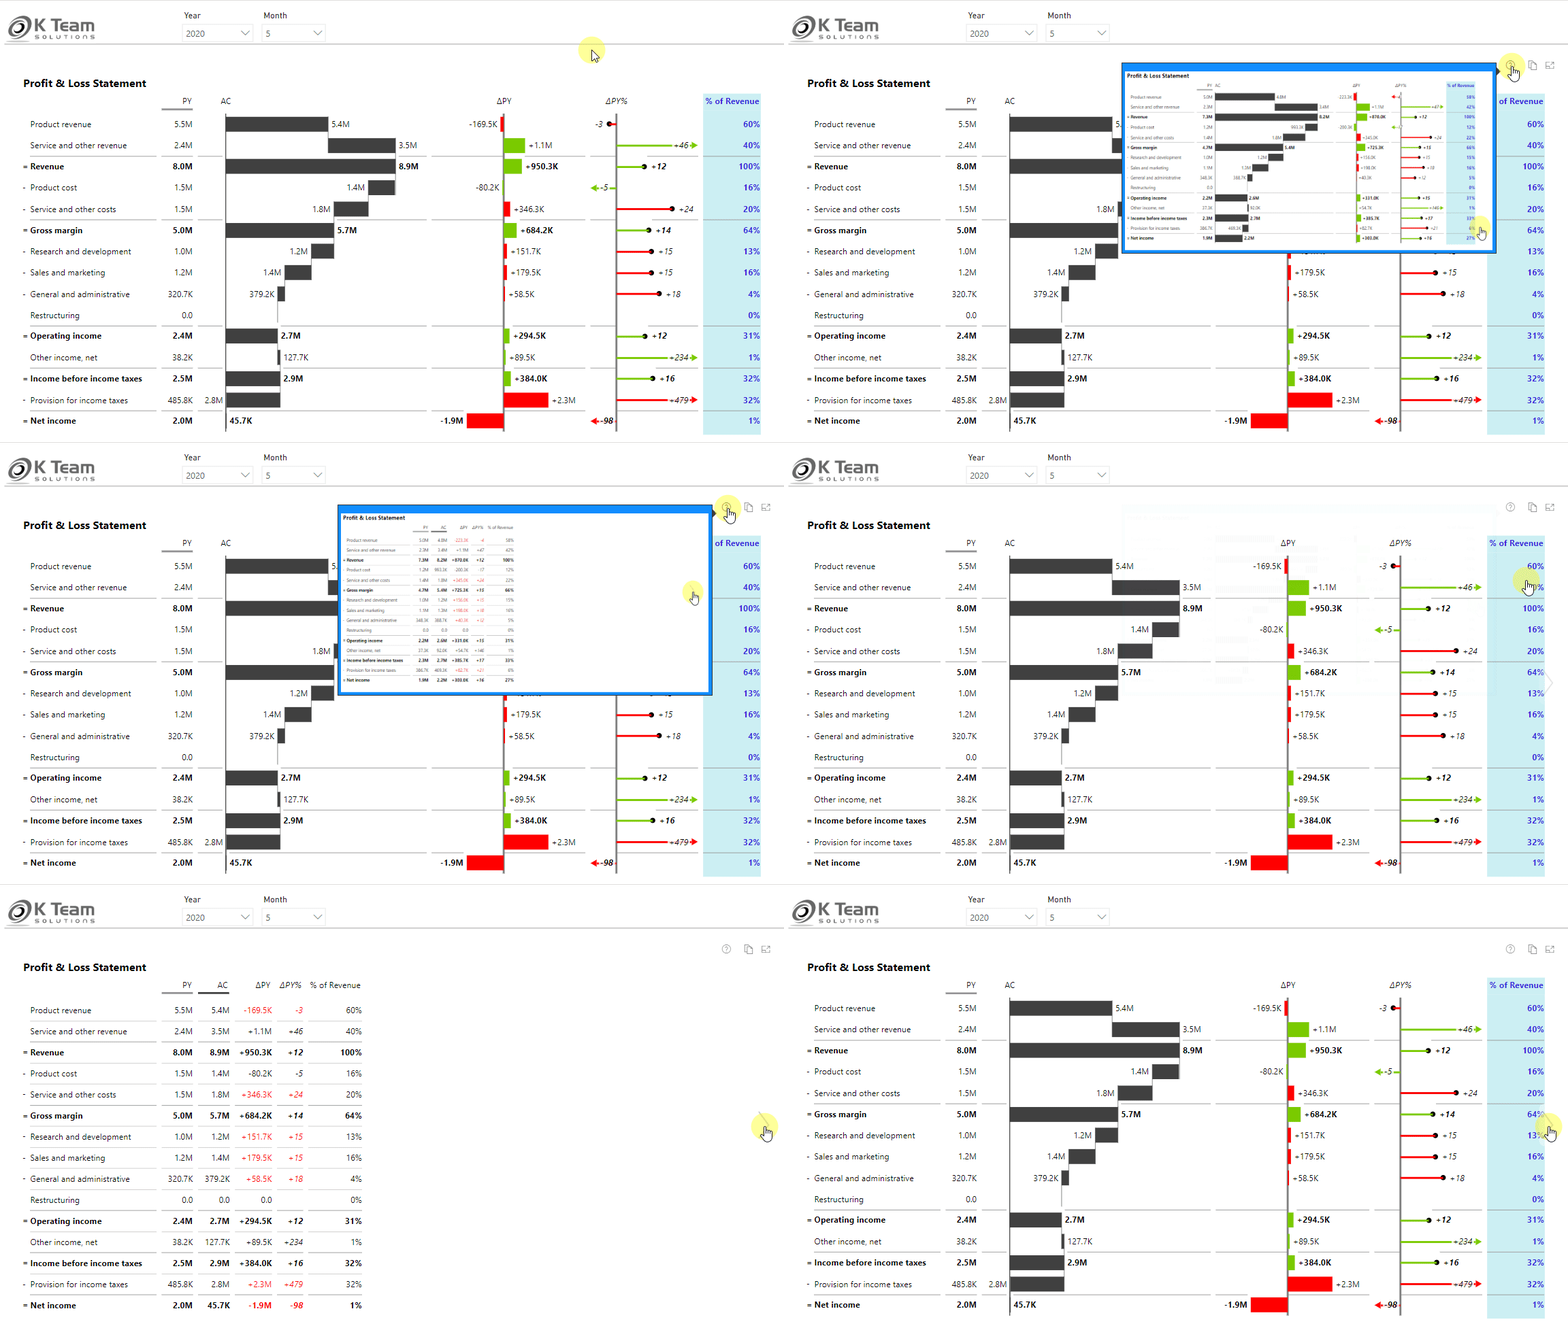
This visual includes a function called Chart Slider with which you can switch between different views. But not everyone knows that, so there is a GIF in the Visual header tooltip, which shows how you can interact with this visual.
How this can be set up is shown in the following video.
2. Help Menu
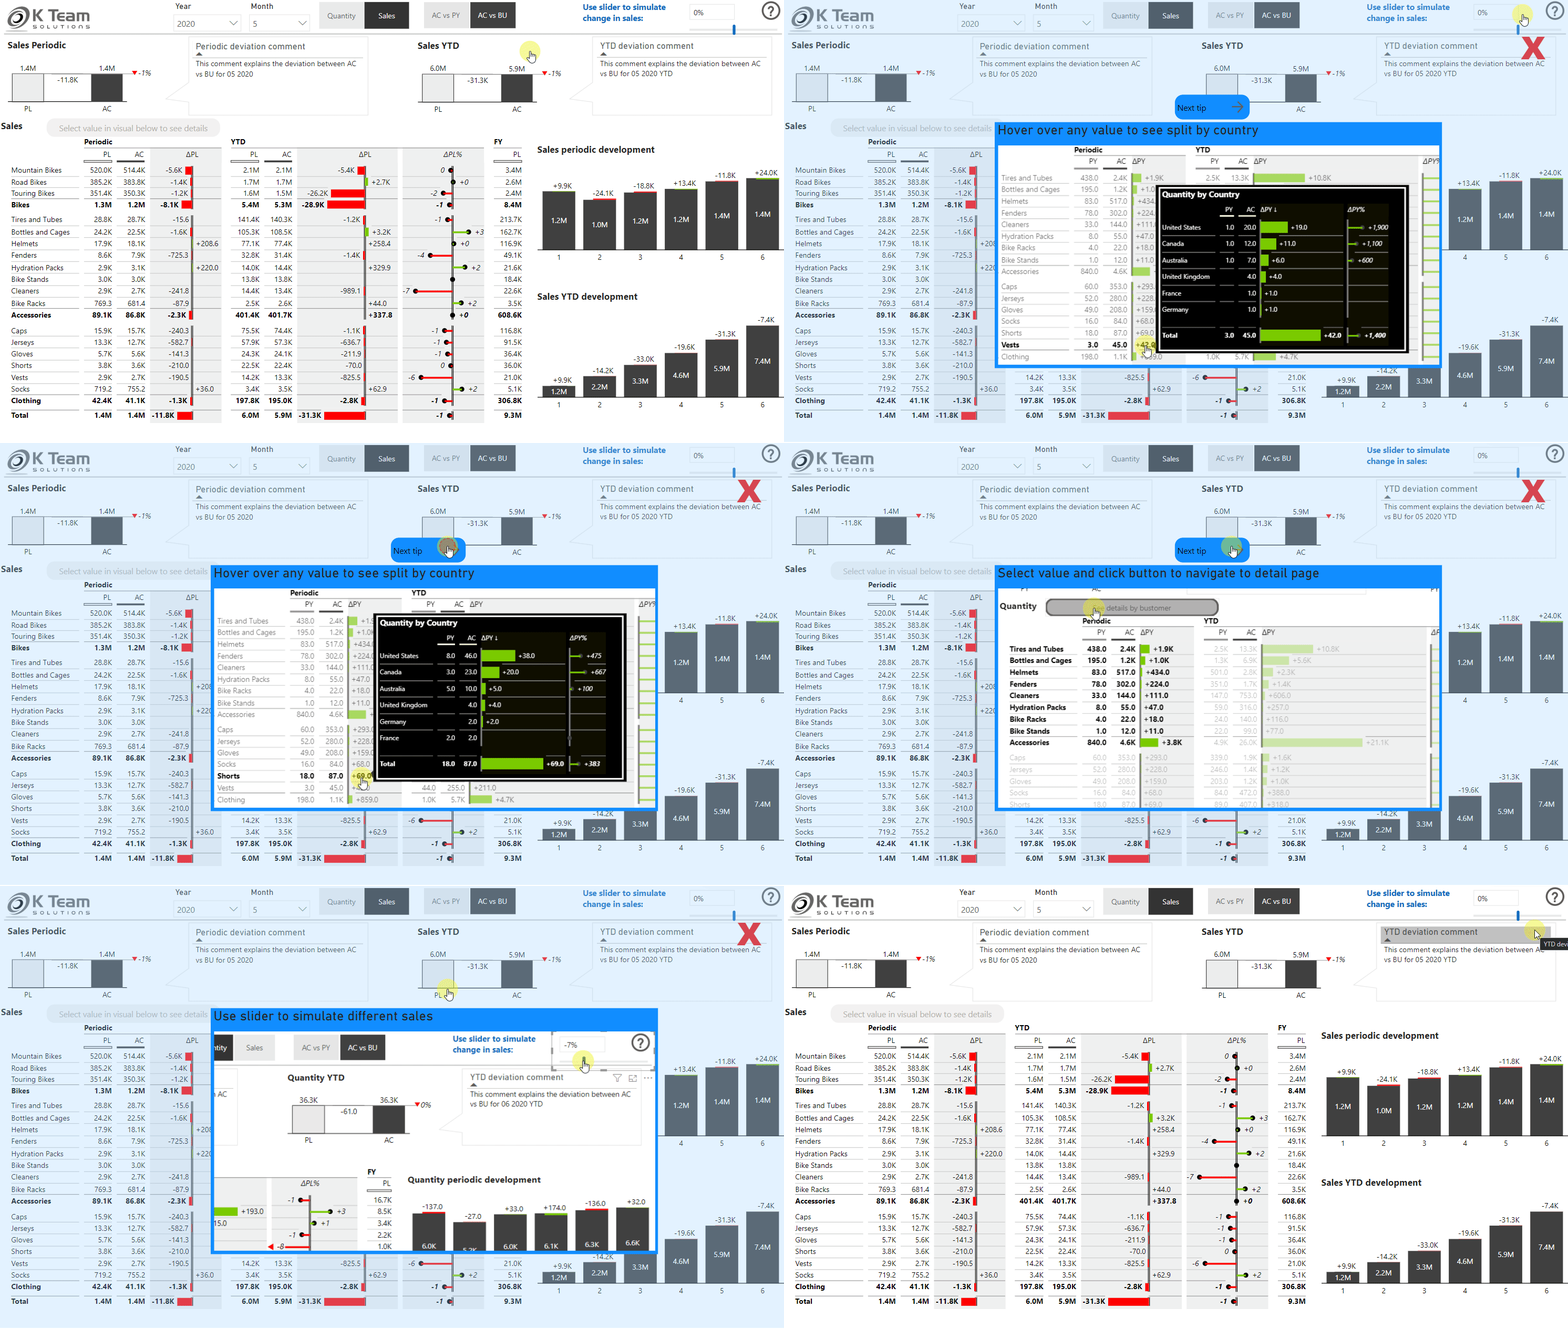
The question mark in the top right corner is known from almost every software and it is common knowledge that you can find help there. In this report, clicking the question mark opens a help menu in which you can look at various tips.
So far I haven’t come across a better way to show end-users how to use a report but if you have, I’d be happy to hear about it.


