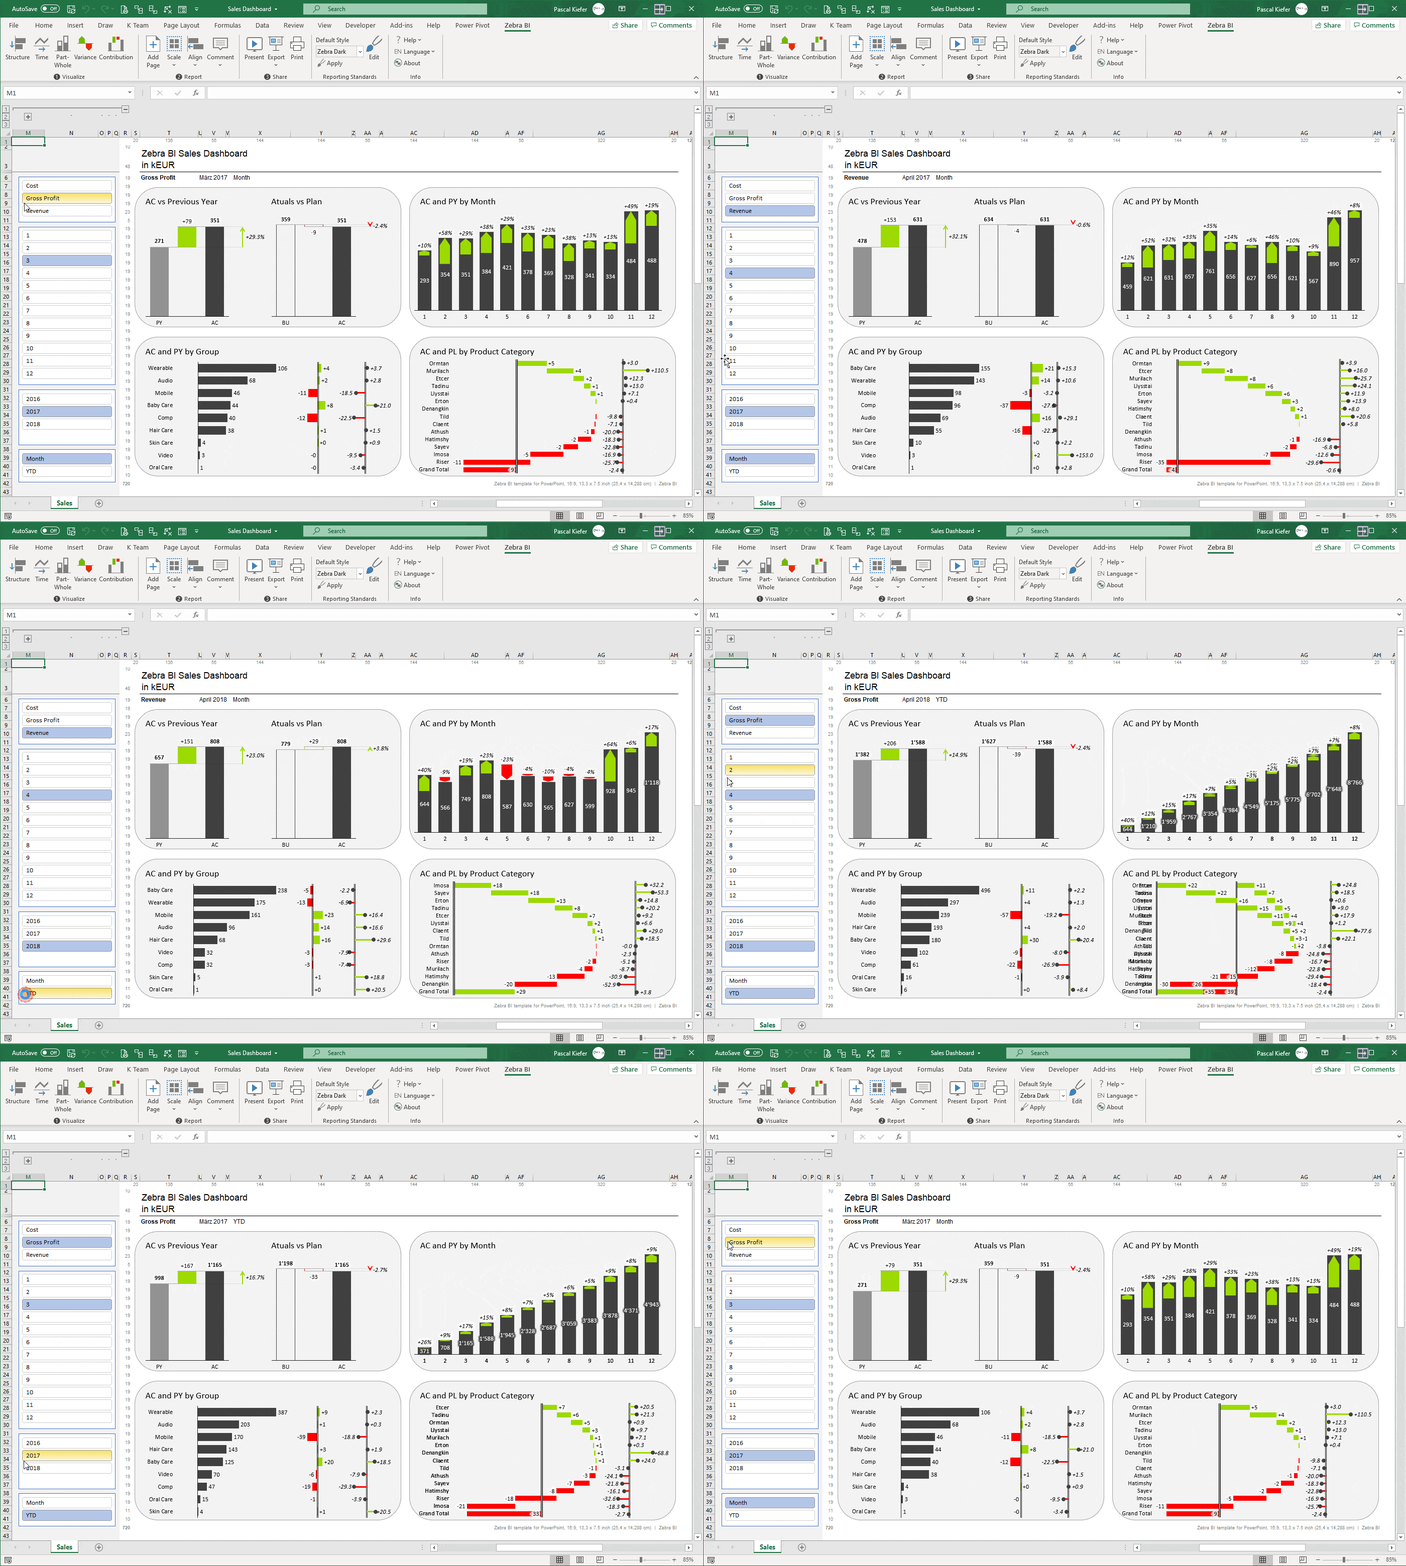
Below you see a fully dynamic Excel report which was created with Power Query / Power Pivot and Zebra BI for Excel.

Reporting with Microsoft Excel
Every company uses some form of reporting in Excel. While the main reports should be done with a BI tool like Power BI, it still makes sense to make some ad-hoc analysis with Excel.
Excel is a very powerful and flexible tool and nearly everybody knows how to work with it more or less. This also leads to some issues. Very often, Excel files have been growing over the years, have been changed by several users and are therefore becoming more and more complex. Sooner or later, the shown numbers might not be correct anymore and if used to make business decisions, this could be fatal.
Even though we recommend Power BI for reporting, we are big supporters of Excel and enjoy working with it. So if you need professional help to set up a state-of-the-art Excel reporting or want to improve an existing solution, we're happy to help.
Did you know that with the help of Power Query, you can load data from a source system directly into Excel and create a proper data model? This eliminates manual tasks and makes sure you always look at the most recent data.
With the use of the fantastic Zebra BI for Excel add-in, you can create stunning reports according to International Business Communication Standards (IBCS) to make sure everybody that looks at the report immediately understands the main message. K Team Solutions and Zebra BI have been partners for many years and we are heavily involved in making the product better with every version. Take a look at this to find out more.
Do you want to see Zebra BI for Excel in action? Simply book a free demo session and we'll show it to you.
Also, take a look at our Blog to find some interesting articles about Excel and what you can do with it.
Below you can see some reports which were built with Zebra BI for Excel

